BOOKZONE
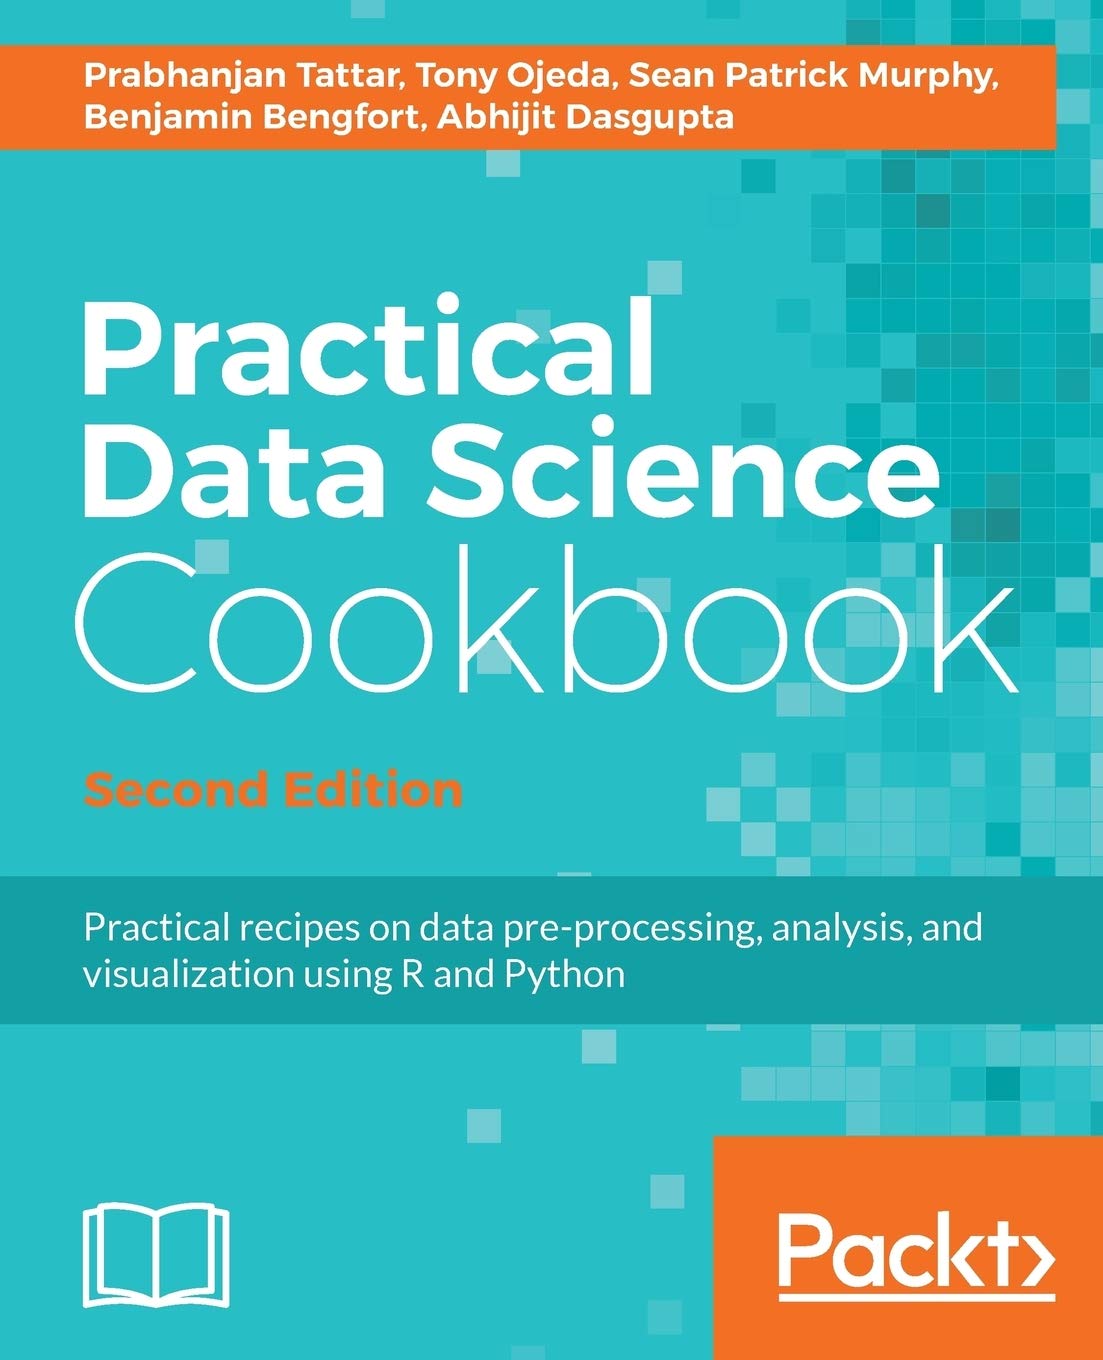
Practical Data Science Cookbook, 2/e
Paperback
by Prabhanjan Tattar
SKU:9781787129627
Bulk Discount Get Exta 5% upto 10%
Share

As increasing amounts of data are generated each year, the need to analyze and create value out of it is more important than ever. Companies that know what to do with their data and how to do it well will have a competitive advantage over companies that don’t. Because of this, there will be an increasing demand for people that possess both the analytical and technical abilities to extract valuable insights from data and create valuable solutions that put those insights to use.
Starting with the basics, this book covers how to set up your numerical programming environment, introduces you to the data science pipeline, and guides you through several data projects in a step-by-step format. By sequentially working through the steps in each chapter, you will quickly familiarize yourself with the process and learn how to apply it to a variety of situations with examples using the two most popular programming languages for data analysis—R and Python.
What You Will Learn
- Learn and understand the installation procedure and environment required for R and Python on various platforms
- Prepare data for analysis by implement various data science concepts such as acquisition, cleaning and munging through R and Python
- Build a predictive model and an exploratory model
- Analyze the results of your model and create reports on the acquired data
- Build various tree-based methods and Build random forest
Authors
Prabhanjan Tattar
Prabhanjan Tattar has 9 years of experience as a statistical analyst. His main thurst has been to explain statistical and machine learning techniques through elegant programming which will clear the nuances of the underlying mathematics. Survival analysis and statistical inference are his main areas of research/interest, and he has published several research papers in peer-reviewed journals and also has authored two books on R: R Statistical Application Development by Example, Packt Publishing, and A Course in Statistics with R, Wiley. He also maintains the R packages gpk, RSADBE, and ACSWR.
Tony Ojeda
Tony Ojeda is an accomplished data scientist and entrepreneur, with expertise in business process optimization and over a decade of experience creating and implementing innovative data products and solutions. He has a master's degree in finance from Florida International University and an MBA with a focus on strategy and entrepreneurship from DePaul University. He is the founder of District Data Labs, is a cofounder of Data Community DC, and is actively involved in promoting data science education through both organizations.
Table of Contents
1: PREPARING YOUR DATA SCIENCE ENVIRONMENT
2: DRIVING VISUAL ANALYSIS WITH AUTOMOBILE DATA WITH R
3: CREATING APPLICATION-ORIENTED ANALYSES USING TAX DATA AND PYTHON
4: MODELING STOCK MARKET DATA
5: VISUALLY EXPLORING EMPLOYMENT DATA
6: DRIVING VISUAL ANALYSES WITH AUTOMOBILE DATA
7: WORKING WITH SOCIAL GRAPHS
8: RECOMMENDING MOVIES AT SCALE (PYTHON)
9: HARVESTING AND GEOLOCATING TWITTER DATA (PYTHON)
10: FORECASTING NEW ZEALAND OVERSEAS VISITORS
11: GERMAN CREDIT DATA ANALYSIS


